 @natematias
Is it safe to go outside? Including disability voices in tests of wildfire smoke forecasts
Published:
When was the last thank-you note that moved you to tears? That happened to me this August, when I got an unexpected email from a team of statisticians at MIT. A year ago, they interviewed me about my respiratory disability and the sensor network I installed to manage my health. Now, at a time when I was sheltering indoors to protect myself from wildfire smoke, they had news: my story from years of DIY data analysis helped them with a fundamental insight about smoke forecasting and public health (pre-print link).
For those of you who don’t know me, I’m a cyclist, computational social scientist, and sometimes advocate who works alongside the public to study our digital environments like social media and AI in the public interest. I’m also a person with serious respiratory conditions that can incapacitate me, especially during wildfires and on days like Christmas when there’s more smoke in the air than usual.
millions of people are now asking a question I have to ask every day: when is it safe to go outside?
When I moved for my dream job to Ithaca New York, my respiratory condition worsened dramatically. Doctors warned my family that temperature inversions in the weather trap woodsmoke and fumes in our beautiful valley, making it unsafe for my health. To maintain my capacity to live and work, I turned to DIY science, installing air quality sensors in friends’ backyards, talking with state environmental scientists, building simple pollution models, and designing software to monitor and alert me about unsafe air pollution. While I am definitely not a public health professional or environmental toxicologist, I am what researchers call a “lived-experience expert.” The work of everyday survival has granted me intimate knowledge of something that scientists often study from afar.
Conditions like mine are becoming more common. Air pollution has become a widespread concern in North America now that wildfire smoke from Canada has made the outdoors unsafe for millions of people for weeks each summer. In 2023 alone, scientists estimate that 5,400 acute deaths and over 64,000 chronic deaths in North America were caused by wildfire smoke. Millions of people are now asking a question I have to ask every day: when is it safe to go outside?
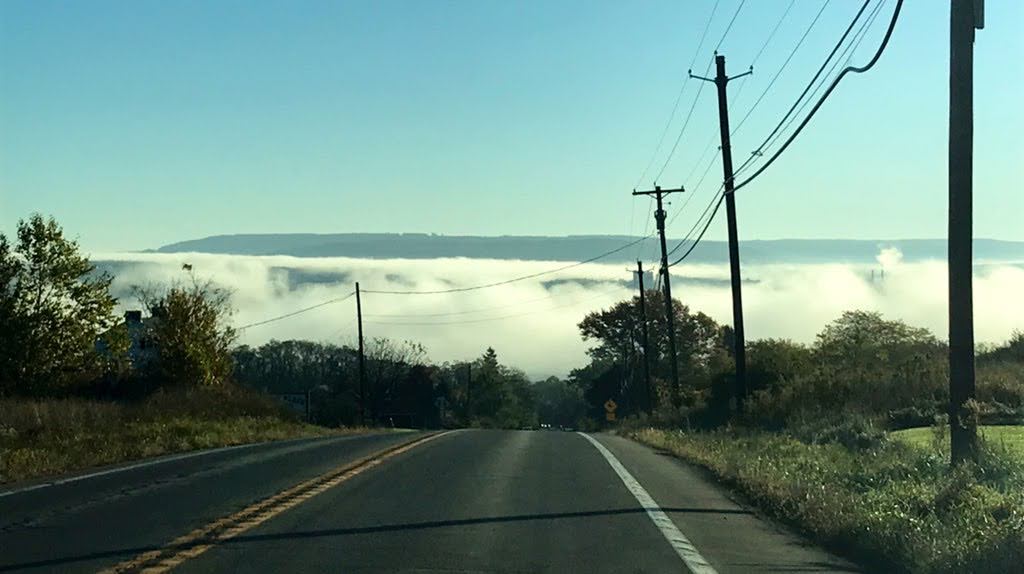
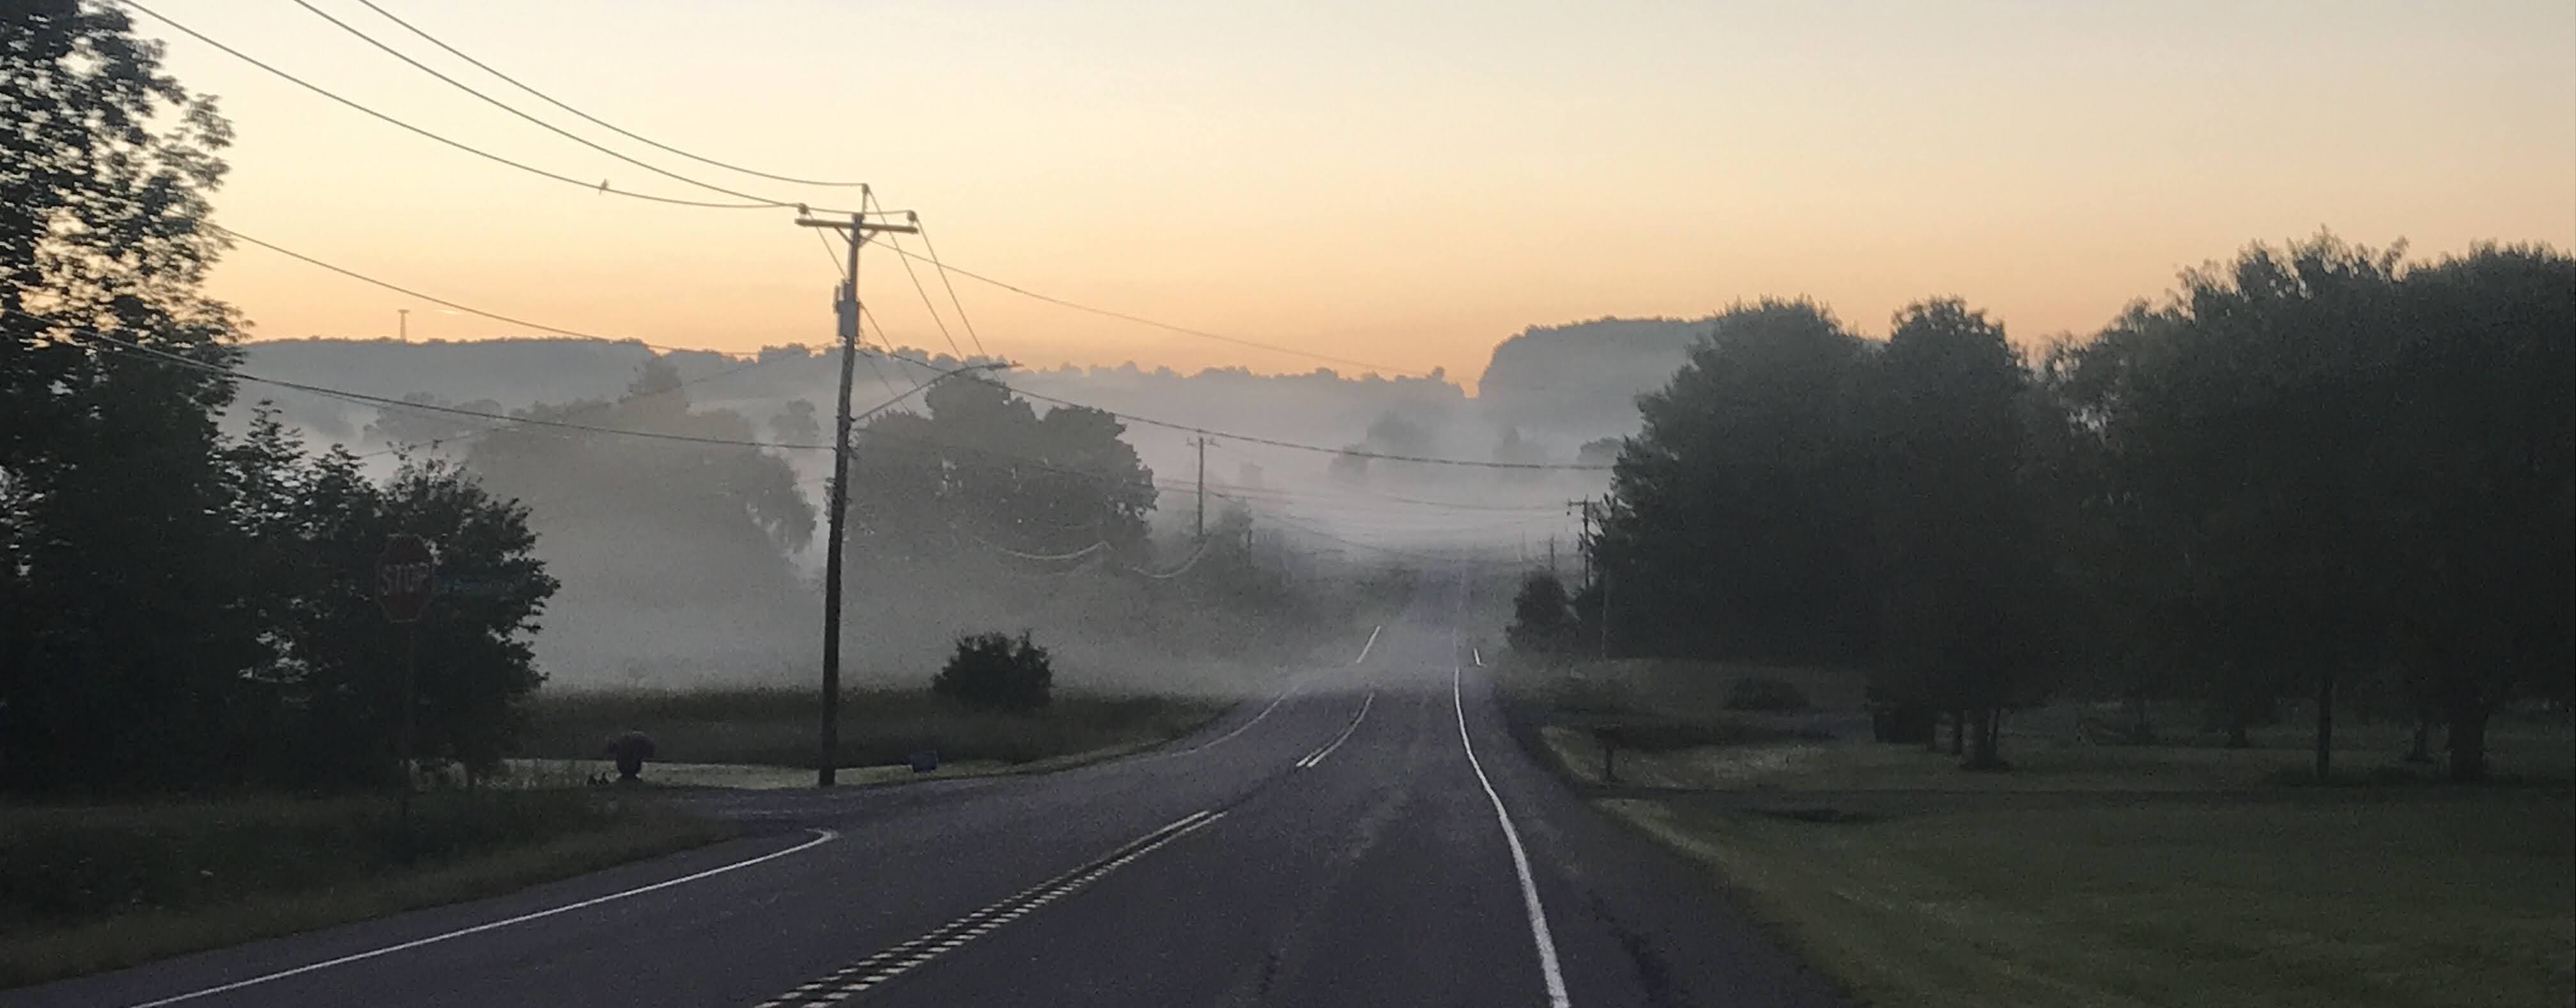 Smoke and fog trapped east of Ithaca New York during a temperature inversion in August 2022
Making Decisions about Air Pollution
What counts as a useful forecast when you’re trying to manage your physical health? That’s the question that Renato, David, Paolo, Arlene, and Tamara at MIT asked me last year after hearing about the sensor network that I installed in the Ithaca area. Recent advances in AI have made it possible to develop new kinds of forecasts, but those forecasts are only as good as the metrics we use to optimize them. Having heard my story, they worried that forecasters might be optimizing for the wrong thing
To understand their question, it’s important to know why the US installed air pollution sensors in the first place. As Irwin explains in his history of air pollution models, air quality sensing came out of concerns about toxic pollution from factories, power plants, and other industrial sources. The idea was that if science could detect hazardous pollutants from human sources, then regulators and industry could improve public health.
The US now manages a sensor network of over thousands of monitors across the country and the world. Government sensors, alongside many more DIY sensors, inform the AirNow fire and smoke map that many people rely on to understand the state of air quality where they are.
Air quality monitoring has transformed many people’s health, including mine. I have especially appreciated forecasts from the New York Department of Environmental Conservation and the Bay Area Air Quality Management District. In 2022, BAAQMD forecasts gave me advance notice to escape smoke from Christmas fires. Just this summer, I was alerted by the NY DEC about wildfire smoke while in the middle of a 300 mile bike ride up the equivalent elevation of Mount Everest. I was able to divert in time to complete my ride indoors and avoid a trip to urgent care.
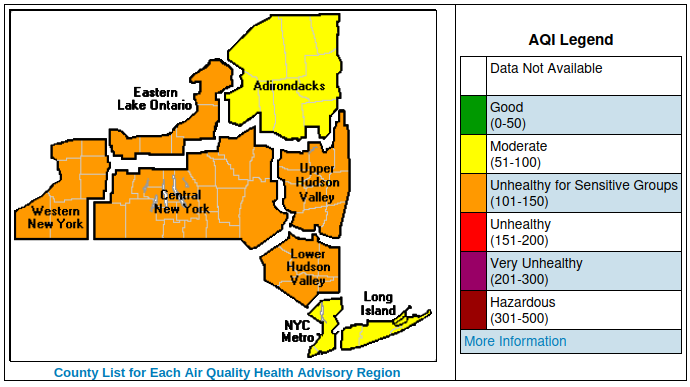 New York Department of Environmental Conservation Air Quality Forecast, August 6, 2025
The Air Quality Index is a brilliantly imagined system that isn’t a direct measure of pollution. Instead, it’s a formula that links sensor results with evidence on human biological responses to pollution exposure, averaged over a period of time often over thousands of square miles. When scientists get updates on hazardous exposure levels, the AQI definition is changed to match the latest evidence without having to re-educate the public. In the 1990s, research found that the AQI alert system significantly reduced asthma hospitalizations.
(Side note: the NowCast AQI is especially fascinating, as this realtime measure varies with the rate of change in air pollution.)
Making Daily Decisions With Pollution Forecasts
In my conversations with the forecasting team at MIT, I explained some of the lessons from my years of trying to survive in a valley town. Thanks to advice from state meteorologists, I’m lucky enough to live upwind near the top of a hill in a house with a high quality air filtration system. On West Hill, the AQI can be a comfortable 10 and a dangerous 60 downtown in the valley, just a mile or two down the road. As a result, survival and quality of life boil down to the following questions:
- whether and when it will be safe to go to work, do shopping, or see friends
- where it will be safe
- enough in advance to notify friends, colleagues, doctors etc that I have to cancel appointments for health reasons
Without advance knowledge about air pollution, my best option is to just stay home, avoid participating in my community, and limit my friendships to a small group who are comfortable with frequent, inconvenient changes. And that’s what I largely do. In the winter, when air pollution fluctuates with the weather and with the use of wood and oil for heating, I rarely leave the house for anything except work. And in the summer when wildfire smoke blankets the region, I stay indoors for weeks at a time. Thank God for grocery delivery and kind neighbors.
The sensor network I developed with the help of my collaborator Alyssa Smith has grown my capacity for wider mobility and interaction. I now get an email when the AQI in any part of the region is over a certain threshold. Even then, I’m only notified about past air pollution due to the moving averages in the AQI system. Even if the valley has long cleared of smoke, it will be many hours before the AQI calculation tells me it’s safe downtown to see a friend.
Flaws in the Evaluation of Wildfire Smoke Forecasts
As climate change increases the frequency and intensity of wildfires and makes wildfire season longer, more people are having our lives disrupted by wildfire smoke. If you live in the U.S. Northeast, you may have spent part of your summer glued to fire.airnow.gov to guess: is a plume of smoke headed for my community? Should I cancel the neighborhood soccer or baseball game? Will it be safe to go out?
In response, scientists and AI companies have developed new forecasting models to advance how we understand the risks from smoke. These are the models that the team from MIT set out to evaluate.
According to the team, statisticians and computer scientists developing wildfire forecasts don’t tend to incorporate health concerns into how they design and test their forecasts. Developers usually test their models by averaging a system’s performance over long periods with metrics like mean absolute error. A few models have been evaluated to help public health officials decide when to issue region-wide air quality alerts, but not for personal decisions (Ainslie 2022).
in the worst case, mis-matched evaluation metrics could optimize forecasts to make dangerous predictions.
While these long-term metrics help scientists prioritize models that match overall smoke trends, the metrics can optimize for misleading forecasts on shorter timescales or in places like Ithaca with high variation. In the worst case, mis-matched evaluation metrics could optimize forecasts to make dangerous predictions.
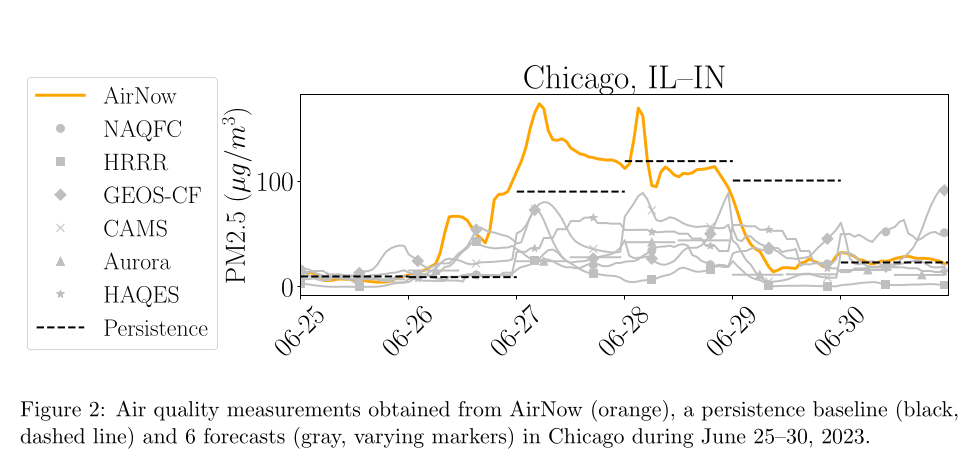
To see how this can happen, look at the chart below from the team at MIT. The orange line shows the observed levels of PM2.5 air pollution in Chicago from June 25-30, when Chicago had the worst air quality in the world due to wildfire smoke. During this spike in smoke, all of the top models (the gray lines) dramatically under-estimated the levels of pollution (the orange line). Then after the pollution dissipated, the models overestimated pollution levels. WIth some evaluation metrics, these errors would perversely average out and validate the forecast as reliable. But if someone tried to make decisions based on these forecasts in practice, they might go outside on dangerous days and stay inside on days when they could be safe.
Overall, the MIT team concluded that “current models provide useful but insufficiently reliable guidance for individuals seeking to minimize health risks in the face of wildfires and other smoke events.”
A New Forecast Metric: When is it Safe to Go Outside?
After consulting the public health literature and speaking with me and others, the team at MIT developed two new metrics to evaluate wildfire smoke forecasting models:
- Should I go out at all today? Identification of high pollution days
- When should I go out during the day? Mean excess exposure
With these metrics, the authors argue, forecasters can see how well a model can guide individual decisions during wildfires and other smoke events. This could be especially helpful at a time when computer scientists are using new kinds of AI/foundation models to drive big changes in forecasting.
When I spoke about the potential of AI with Renato Berlinghieri, lead author of the paper, he said: “One of the most interesting results is the one from the Microsoft Foundation models. It was trained mostly on weather data over the whole earth. They also used it for fine tuning air pollution. When they care about accuracy over the whole planet, it seems like it’s more accurate, but it’s not a great model for local immediate forecast purposes.”
How Metrics Save Lives and Improve Quality of Life
Talking with the team, I thought of the urgency of my health issues and the slow pace of science. We can expect more wildfires next year, and the next, and the next. Thousands of people will die every year while we search for solutions to climate change, wildfires, and better forecasting. So I asked them: how does something like this actually reach people?
Thousands of people will die every year while we search for solutions to climate change, wildfires, and better forecasting.
Their first answer was that we have to get the metrics right. If people make decisions with forecasts based on flawed metrics, it could literally kill people if we go outside into hazardous pollution. And their proposed metrics are just two possibilities. Out of all the money going into AI weather forecasting, a percentage of that needs to prioritize metrics, information visualization, the psychology of decision-making, and public health communication.
Their second answer was that we need people to advocate for forecasts that could save lives and improve quality of life. That advocacy could happen at multiple levels of society, including groups like the American Lung Association and the Asthma and Allergy Foundation of America and the environmental justice movement. It’s also something that meteorologists at news organizations and government agencies can call for when procuring technology - amidst growing public demand for reliable smoke forecasts during wildfire season.
Finally (and this is where I came to tears), the team at MIT told me that we need more people like me to talk about our experience and bring an open, curious, and analytical mind to the challenge of living with a respiratory disability. As I recently argued in PNAS, the math is only as good as the purpose behind it, and people with lived experiences offer an irreplaceable perspective on what matters the most.
Whether or not this new article passes peer review, I hope it expands the conversation about how to evaluate smoke forecasts and whose needs should be prioritized.
I remember a conversation with my partner at one of my darkest moments in Ithaca when I realized that the only way I could keep hope was to pray and collect data. I now see disability inclusion as something that the rest of society should prioritize, and Im grateful to this team of scientists for doing so.
Thank you, Renato, David, Palo, Arlene, and Tamara, for making all this feel a bit more worth it.
Further References
- Ainslie, B., So, R., & Chen, J. (2022). Operational evaluation of a wildfire air quality model from a forecaster point of view. Weather and Forecasting, 37(5), 681-698.
- Miller, C. A. (2021). Fifty years of EPA science for air quality management and control. Environmental Management, 67(6), 1017-1028.
- Irwin, J. S. (2002). A historical look at the development of regulatory air quality models for the United States Environmental Protection Agency.
- Jasanoff, S. (1992). Science, Politics, and the Renegotiation of Expertise at EPA. Osiris, 7, 194-217.
- Neidell, M., & Kinney, P. L. (2010). Estimates of the association between ozone and asthma hospitalizations that account for behavioral responses to air quality information. Environmental Science & Policy, 13(2), 97-103.